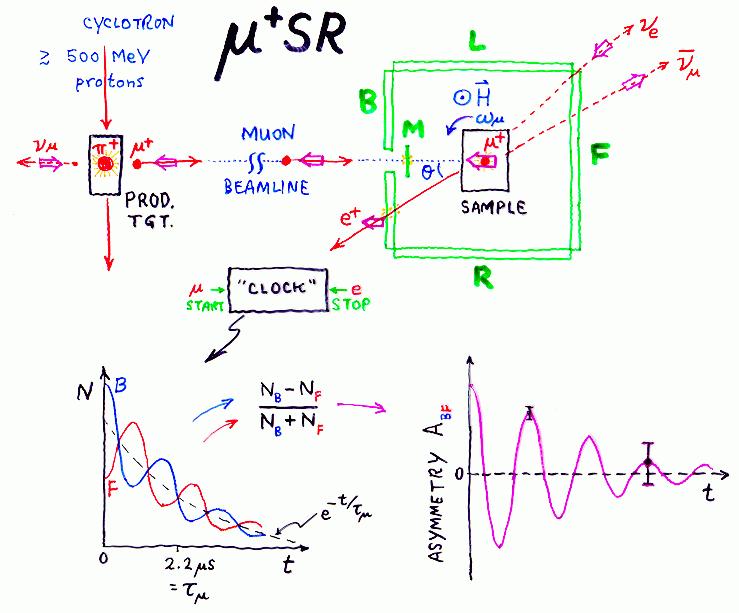
The protons hit a production target and make pions. Some of the pions stop in the skin of the production target and decay into muons and neutrinos; the muons so produced are called "surface muons" for that reason.
Thanks to parity violation in the weak interaction, surface muons are perfectly spin polarized opposite to their momentum, so when a muon is transported down the beamline and through a thin M counter to stop in the sample being studied, it arrives 100% spin polarized - a significant improvement on other magnetic resonance probes.
The incoming muon produces a pulse in the M scintillator which starts an electronic "clock" with a typical time resolution of about 1 ns (a billionth of a second). When it decays (and average of about 2.2 µs later) it emits a fast positron preferentially along the direction of its spin at that instant. The positron is detected in one of the e counters (B,F,L,R), stopping the clock.

The time interval between muon stop and positron detection is digitized by the clock and a count is added to the bin of a "time histogram" corresponding to that time interval. This process is repeated a few million times (usually taking somewhere between a few minutes and a few hours, depending upon the beam conditions and the apparatus used) to generate a time spectrum N(t) for each of the positron detectors. This time spectrum displays the exponential lifetime distribution of the muon and also the time variation of the relative probability of the positron's being emitted in the direction of that detector. If (for instance) a magnetic field H is applied perpendicular to the initial muon polarization, the muon spins will precess at the Larmor frequency (about 135.5 MHz per Tesla of applied field) causing the muon polarization to sweep past each detector periodically and producing an oscillation in the time spectrum superimposed upon the exponential decay.
Two opposing detectors will have this oscillation 180o out of phase with respect to each other, so one can (after removal of any time-independent background and assuming the same intrinsic efficiency for each detector) form the asymmetry spectrum A(t) for that pair of counters by dividing the difference between their time spectra by the sum of their time spectra at each time bin.
The asymmetry spectrum displays the anisotropy in that direction just like the free induction decay (FID) signal in NMR except for the following features: