

Next: 4.4 Field Distribution of
Up: 4 Modelling the Internal
Previous: 4.2 Pinning, Thermal Fluctuations,
Traditionally, the behaviour of the magnetic penetration depth in
the vortex state of a superconductor has been determined from
the variation of the second moment (i.e. the square of the width)
of the  SR line shape.
The second moment of the local magnetic
field distribution n(B) is
|  |
(1) |
where  is the first moment of n(B) (i.e. the
average local magnetic field).
At moderate magnetic fields,
the second moment of the field distribution for a vortex lattice (which
is considered in the next section) has been shown in the London picture
to be [123]
|  |
(2) |
A simple way to model
the second moment is to assume that n(B) is a Gaussian
distribution of static internal magnetic fields.
The corresponding muon polarization function is [47]
|  |
(3) |
where  is the muon depolarization rate.
For a Gaussian field distribution, the second moment is given by
[114]
|  |
(4) |
so that
|  |
(5) |
However, this method is extremely crude since
the field distribution
corresponding to a vortex lattice is generally asymmetric.
It is mentioned here only because many of the earlier  SR experiments
arrived at conclusions regarding the pairing-state symmetry in the
high-Tc compounds based on this type of analysis
[114,115,116,117,118].
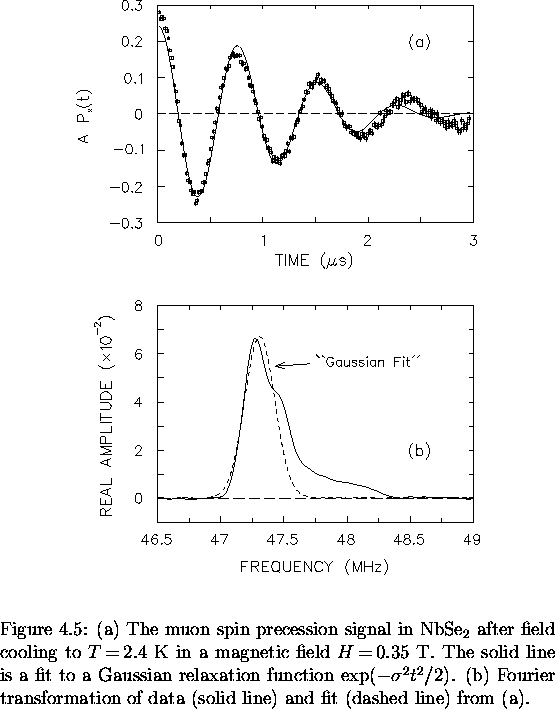
Figure 4.5(a) shows an example of fitting the early time part of
the muon-spin precession signal in NbSe2 with a Gausssian
relaxation function. The spectrum was obtained by
field cooling the sample to
  K in a magnetic field
 T applied parallel to the
  -axis.
The quality of the fit (
 ) is 4076 for 412 degrees of freedom.
The real Fourier transform of both the data and the Gaussian fit
are shown in Fig. 4.5(b).
The small peak near 47.5 MHz is due to muons which miss the
sample and avoid the background suppression system. Typically this
constitutes 5 to 15% of the total signal amplitude for our apparatus.
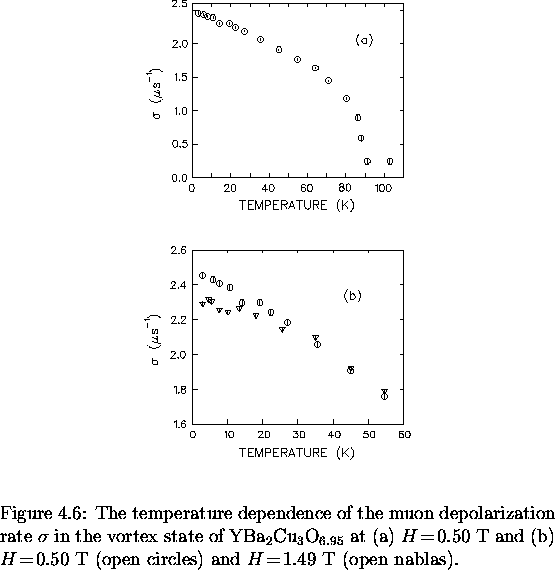
Figure 4.6(a) shows the temperature dependence of  for
a mosaic of three high quality YBa2Cu3O6.95 single crystals.
Despite the poor quality of the fits, the Gaussian
function appears to effectively model the change in the second moment
of the
  SR line shape. As the temperature is increased,
  decreases dramatically due to the natural progression towards
a symmetric internal field distribution as the penetration depth grows.
A serious drawback with this method is its inability to
resolve the several phenomena
which separately contribute to the width of the
  SR line shape. For example, one
cannot assume that the linear T dependence of
  at low temperatures
necessarily implies that
  has the same linear dependence.
For instance, some of the change in the line width
may arise from
thermal fluctuations of the vortex lines which result in a narrowing of
the
  SR line shape at higher temperatures.
Thus, the magnitude of the linear term in
  could be
different than that of
  , or worse,
  could have
a different leading term.
Consider Fig. 4.6(b), which shows the temperature
dependence of the muon depolarization rate  in single crystal
YBa2Cu3O6.95 for two different applied magnetic fields.
There is a distinct drop in
  at low T when the applied magnetic
field is changed from 0.5 to 1.5 T. Moreover, the term linear in T
decreases at the higher field. However, there is no way to determine
whether the field dependence of the muon depolarization rate is due to
intrinsic or extrinsic effects. We now believe that the field dependence
of
  observed in some of the earlier
  SR experiments
was misinterpreted as being due to an increase in flux-lattice
disorder at low magnetic fields. The precise cause of this field
dependence will be addressed later on in this report.


There are many other serious limitations or problems associated with
using a simple Gaussian analysis. For instance, the shape of the internal
field distribution will change when there are variations in the
vortex-lattice geometry and at a crossover at low fields where
the intervortex spacing L equals  . Fitting to a Gaussian
function will misidentify these changes in the
  SR line shape
as changes in
  .This simple analysis is also insensitive
to the high-field tail of the measured
internal field distribution--so that no information regarding
the structure of the vortex cores or the behaviour of
  can
be obtained.


Next: 4.4 Field Distribution of
Up: 4 Modelling the Internal
Previous: 4.2 Pinning, Thermal Fluctuations,
![]() SR line shape.
The second moment of the local magnetic
field distribution n(B) is
SR line shape.
The second moment of the local magnetic
field distribution n(B) is


![]() for
a mosaic of three high quality YBa2Cu3O6.95 single crystals.
Despite the poor quality of the fits, the Gaussian
function appears to effectively model the change in the second moment
of the
for
a mosaic of three high quality YBa2Cu3O6.95 single crystals.
Despite the poor quality of the fits, the Gaussian
function appears to effectively model the change in the second moment
of the ![]() SR line shape. As the temperature is increased,
SR line shape. As the temperature is increased, ![]() decreases dramatically due to the natural progression towards
a symmetric internal field distribution as the penetration depth grows.
A serious drawback with this method is its inability to
resolve the several phenomena
which separately contribute to the width of the
decreases dramatically due to the natural progression towards
a symmetric internal field distribution as the penetration depth grows.
A serious drawback with this method is its inability to
resolve the several phenomena
which separately contribute to the width of the ![]() SR line shape. For example, one
cannot assume that the linear T dependence of
SR line shape. For example, one
cannot assume that the linear T dependence of ![]() at low temperatures
necessarily implies that
at low temperatures
necessarily implies that ![]() has the same linear dependence.
For instance, some of the change in the line width
may arise from
thermal fluctuations of the vortex lines which result in a narrowing of
the
has the same linear dependence.
For instance, some of the change in the line width
may arise from
thermal fluctuations of the vortex lines which result in a narrowing of
the ![]() SR line shape at higher temperatures.
Thus, the magnitude of the linear term in
SR line shape at higher temperatures.
Thus, the magnitude of the linear term in ![]() could be
different than that of
could be
different than that of ![]() , or worse,
, or worse, ![]() could have
a different leading term.
could have
a different leading term.
![]() in single crystal
YBa2Cu3O6.95 for two different applied magnetic fields.
There is a distinct drop in
in single crystal
YBa2Cu3O6.95 for two different applied magnetic fields.
There is a distinct drop in ![]() at low T when the applied magnetic
field is changed from 0.5 to 1.5 T. Moreover, the term linear in T
decreases at the higher field. However, there is no way to determine
whether the field dependence of the muon depolarization rate is due to
intrinsic or extrinsic effects. We now believe that the field dependence
of
at low T when the applied magnetic
field is changed from 0.5 to 1.5 T. Moreover, the term linear in T
decreases at the higher field. However, there is no way to determine
whether the field dependence of the muon depolarization rate is due to
intrinsic or extrinsic effects. We now believe that the field dependence
of ![]() observed in some of the earlier
observed in some of the earlier ![]() SR experiments
was misinterpreted as being due to an increase in flux-lattice
disorder at low magnetic fields. The precise cause of this field
dependence will be addressed later on in this report.
SR experiments
was misinterpreted as being due to an increase in flux-lattice
disorder at low magnetic fields. The precise cause of this field
dependence will be addressed later on in this report.
![]() . Fitting to a Gaussian
function will misidentify these changes in the
. Fitting to a Gaussian
function will misidentify these changes in the ![]() SR line shape
as changes in
SR line shape
as changes in ![]() .This simple analysis is also insensitive
to the high-field tail of the measured
internal field distribution--so that no information regarding
the structure of the vortex cores or the behaviour of
.This simple analysis is also insensitive
to the high-field tail of the measured
internal field distribution--so that no information regarding
the structure of the vortex cores or the behaviour of ![]() can
be obtained.
can
be obtained.