


Next: 3 Cryocrystals as Samples
Up: 2 Muon Spin Rotation
Previous: 2.2.1 Time-Differential
We are interested in extracting the asymmetry, the signal manifesting
the influence of the muon's environment on its spin.
Ultimately we will want to fit the experimental asymmetry
to a model function in order to measure some physical property,
but ideally the experimental asymmetry should be obtained
independently of the model function.
One way of extracting the signal from the raw data
is to make use of the symmetry of the detectors on opposite
sides of the sample.
With this geometry the two detectors view the same positron
angular distribution, but from diametrically opposed directions,
so that the counts in the two histograms are
(for the Back-Front pair)
| ![\begin{displaymath}
N_{\rm B,F}(t) = N_0 \left\{ b_{\rm B,F} + [1 \pm a_{\rm B,F}(t)]
{e}^{t/\tau_{\mu}}\right \}.\end{displaymath}](img46.gif) |
(7) |
We can then calculate the asymmetry  for the (B,F) pair
| ![\begin{displaymath}
a_{\rm z}(t) = \frac{[N_{\rm B}(t) - N_0 b_{\rm B}]
- [N_{...
...\rm B}(t) - N_0 b_{\rm B}] +
[N_{\rm F}(t) - N_0 b_{\rm F}]},\end{displaymath}](img48.gif) |
(8) |
naively assuming a common asymmetry 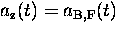 .Ideally, the efficiency (probability of a particle being detected)
of all positron detectors would be the same, as would be the solid
angle they subtend. In general neither of these actually holds, so
corrections are needed to avoid distorting the signal.
It is easy to see, for example, that if the sample were closer to the
B positron detector than to F, then B would intercept (all other things
being equal) more positrons by virtue of its larger solid angle, and
because it averages over a greater range in
.Ideally, the efficiency (probability of a particle being detected)
of all positron detectors would be the same, as would be the solid
angle they subtend. In general neither of these actually holds, so
corrections are needed to avoid distorting the signal.
It is easy to see, for example, that if the sample were closer to the
B positron detector than to F, then B would intercept (all other things
being equal) more positrons by virtue of its larger solid angle, and
because it averages over a greater range in  , the amplitude
of the precession signal in our TF experiment would be lower.
Photomultiplier tube characteristics, operating voltages and
discriminator settings will have a direct bearing on the efficiency of
each detector. It would be a difficult task to match a pair
of detectors so they had identical characteristics;
fortunately, it is not necessary to do so.
If we allow for differing efficiencies
, the amplitude
of the precession signal in our TF experiment would be lower.
Photomultiplier tube characteristics, operating voltages and
discriminator settings will have a direct bearing on the efficiency of
each detector. It would be a difficult task to match a pair
of detectors so they had identical characteristics;
fortunately, it is not necessary to do so.
If we allow for differing efficiencies  and asymmetries
Ai Pz(t), where Pz(t) is the spin polarization along the
z-axis, which is common to the Back and Front detectors, then
each histogram is described by
and asymmetries
Ai Pz(t), where Pz(t) is the spin polarization along the
z-axis, which is common to the Back and Front detectors, then
each histogram is described by
| ![\begin{displaymath}
N_{\rm B,F}(t) = N_0 \left\{b_{\rm B,F} +\eta_{\rm B,F}
[1 \pm A_{\rm B,F} P_z(t)] e^{-t/\tau_{\mu}} \right\}\end{displaymath}](img51.gif) |
(9) |
and the experimental asymmetry is now
in which  and
and
 .Rearranging this we obtain a function of the experimental
asymmetry a(t) corrected for differences between detectors.
.Rearranging this we obtain a function of the experimental
asymmetry a(t) corrected for differences between detectors.
| 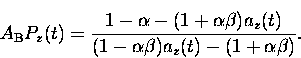 |
(10) |
This introduces two free parameters  and
and  that
can be obtained by fitting a model spin polarization function
to the experimental asymmetry.
The same procedure can be carried out for the other pair of
detectors on the x or y axes. (Usually there is no need
to use detectors on more than two axes since there can never
be any asymmetry along an axis that is always perpendicular
to the muon spin.)
that
can be obtained by fitting a model spin polarization function
to the experimental asymmetry.
The same procedure can be carried out for the other pair of
detectors on the x or y axes. (Usually there is no need
to use detectors on more than two axes since there can never
be any asymmetry along an axis that is always perpendicular
to the muon spin.)
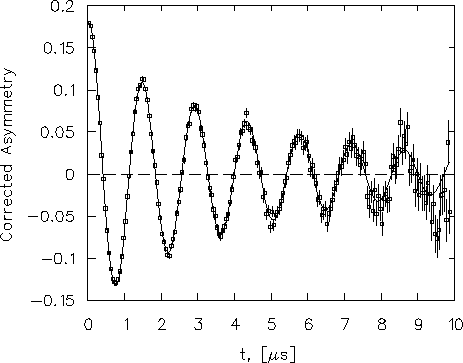
Returning to our example TF experiment,
Fig. 2.7 shows the corrected
asymmetry extracted from the (B,F) pair of detectors.
Figure 2.7:
The corrected asymmetry obtained from the Back-Front
histogram pair using Eq. (2.13).
Error bars shown and all parameter errors obtained in fitting
are derived from counting statistics.
 |
The evolution of the muon spin polarization is
essentially the same as the familiar free induction decay signal
of nuclear magnetic resonance.
The most obvious characteristic is the Larmor precession frequency,
giving the mean magnetic field at the muon site.
We will need to draw on everything we know about the sample
from other sources in order to
interpret the polarization relaxation function.
For example, if we know the sample contains atoms
possessing magnetic moments
then we expect the muon will be subject to internal fields
which may fluctuate in time or in space (or both).
In this case, muons will experience different local
fields and so precess at different frequencies,
which would be reflected in the loss of coherence of
the precessing muon ensemble.
In other cases, the disappearance of polarization may be entirely
due to one or more chemical reactions.
The loss of polarization then simply reflects the amount
of the muon ensemble that has undergone a chemical reaction.
This must be the case for the signal seen in our Ne sample, where
there are no nuclear magnetic moments present. The amplitude of the
muon signal decreases with time because the muons pick up stray
electrons and so form neutral muonium atoms
(a topic that will occupy much of our attention in
chapters to follow) which behave entirely differently
- the ``diamagnetic" muon signal gradually vanishes with time.
In either case we need to have some idea qualitatively what
may be happening to the muon before we can extract quantitative
information by fitting a model polarization function.
Measuring the polarization function is the easy part;
deducing the correct model is usually challenging, but
yields all the physics.
We have discussed here only the most common sorts of  experiments. Other techniques, falling under the general
label of Time-Integral , are described elsewhere,
[5,6] including level-crossing
resonance experiments and RF-.
experiments. Other techniques, falling under the general
label of Time-Integral , are described elsewhere,
[5,6] including level-crossing
resonance experiments and RF-.
Next: 3 Cryocrystals as Samples
Up: 2 Muon Spin Rotation
Previous: 2.2.1 Time-Differential