Figure 5.1 shows the time evolution of the muon-spin polarization taken under field-cooled (FC) and
zero-field cooled (ZFC) conditions at ![]() =
= ![]() K. In the FC procedure, the sample is cooled to temperatures below
K. In the FC procedure, the sample is cooled to temperatures below ![]() in an applied magnetic field. Generally speaking, for intermediate applied fields
in an applied magnetic field. Generally speaking, for intermediate applied fields ![]() <
< ![]() <
< ![]() , this
results in a well-ordered vortex lattice in the superconducting state. Consequently, the time spectra show an oscillating
signal with an amplitude damped out over time due to the inhomogeneous internal magnetic field distribution of the vortex
lattice. In the ZFC procedure, the sample is cooled below
, this
results in a well-ordered vortex lattice in the superconducting state. Consequently, the time spectra show an oscillating
signal with an amplitude damped out over time due to the inhomogeneous internal magnetic field distribution of the vortex
lattice. In the ZFC procedure, the sample is cooled below ![]() in zero external magnetic field and then an external field
is applied. In this case, pinning at the sample edges usually prevents the magnetic flux from entering the bulk of the
sample at low external magnetic fields (
in zero external magnetic field and then an external field
is applied. In this case, pinning at the sample edges usually prevents the magnetic flux from entering the bulk of the
sample at low external magnetic fields (
![]() Oe). Consequently the ZFC asymmetry spectra resemble those in the ZF
measurements. At higher field (
Oe). Consequently the ZFC asymmetry spectra resemble those in the ZF
measurements. At higher field (![]() =
= ![]() Oe) under ZFC conditions, the magnetic flux fully penetrates the bulk of the
sample, but in the absence of a strong repulsive interaction between the vortices, random defects in the sample exert a
pinning force on the vortices, resulting in a highly disordered arrangement.
Oe) under ZFC conditions, the magnetic flux fully penetrates the bulk of the
sample, but in the absence of a strong repulsive interaction between the vortices, random defects in the sample exert a
pinning force on the vortices, resulting in a highly disordered arrangement.
|
Figure 5.2 shows the time evolution of the muon-spin polarization taken under FC and ZFC conditions at ![]() =
=
![]() Oe at a number of temperatures. In the FC procedure [Fig. 5.2(a)], the muon-spin depolarization rate
decreases with increasing temperature due to the growth of the in-plane magnetic penetration depth
Oe at a number of temperatures. In the FC procedure [Fig. 5.2(a)], the muon-spin depolarization rate
decreases with increasing temperature due to the growth of the in-plane magnetic penetration depth
![]() , which is
the length scale over which magnetic field decays outside of the vortex core. On the other hand, under ZFC conditions
[Fig. 5.2(b)], pinning at the sample surface prevents the magnetic flux from entering the bulk of the sample
at low temperatures. At higher temperature (
, which is
the length scale over which magnetic field decays outside of the vortex core. On the other hand, under ZFC conditions
[Fig. 5.2(b)], pinning at the sample surface prevents the magnetic flux from entering the bulk of the sample
at low temperatures. At higher temperature (![]() K), magnetic flux penetrates deeper into the sample due to thermal
depinning and an increase of
K), magnetic flux penetrates deeper into the sample due to thermal
depinning and an increase of
![]() .
.
|
Figure 5.3 shows fast Fourier transforms (FFTs) of the muon-spin precession signals at ![]() =
= ![]() Oe recorded
under FC conditions. To eliminate systematic errors, these measurements were taken at different temperatures in a random
sequence. The FFTs give an approximate picture of the internal magnetic field distribution
Oe recorded
under FC conditions. To eliminate systematic errors, these measurements were taken at different temperatures in a random
sequence. The FFTs give an approximate picture of the internal magnetic field distribution ![]() . Although the sharp
features of
. Although the sharp
features of ![]() are smeared due to the effects described in section 2.4, the FFTs still provide useful insight into the
nature of
are smeared due to the effects described in section 2.4, the FFTs still provide useful insight into the
nature of ![]() . Above
. Above ![]() , the field distribution is broadened by both the electronic and nuclear magnetic moments. The
, the field distribution is broadened by both the electronic and nuclear magnetic moments. The
![]() SR linewidth was observed to increase with increasing
SR linewidth was observed to increase with increasing ![]() . This behaviour suggests that there is an inhomogeneous
distribution of local magnetic susceptibilities in the sample, which results in a distribution of muon frequency shifts. It
is likely that the inhomogeneity arises from spatial variations of charge doping. Below
. This behaviour suggests that there is an inhomogeneous
distribution of local magnetic susceptibilities in the sample, which results in a distribution of muon frequency shifts. It
is likely that the inhomogeneity arises from spatial variations of charge doping. Below ![]() , the field distribution is
further broadened and becomes asymmetric, due to the inhomogeneous field produced by a vortex lattice. To minimize the
effects of the inhomogeneous local magnetic susceptibility, the magnetic penetration depth measurements were performed at
low external magnetic fields.
, the field distribution is
further broadened and becomes asymmetric, due to the inhomogeneous field produced by a vortex lattice. To minimize the
effects of the inhomogeneous local magnetic susceptibility, the magnetic penetration depth measurements were performed at
low external magnetic fields.
![\includegraphics[width=12cm]{freq-fft.eps}](img223.png)
|
In Nd![]() CuO
CuO![]() , which is the parent compound of the related electron-doped cuprate
, which is the parent compound of the related electron-doped cuprate
Nd![]() Ce
Ce![]() CuO
CuO![]() , the
muon stopping site was found to be near an O(2) oxygen midway between two CuO
, the
muon stopping site was found to be near an O(2) oxygen midway between two CuO![]() planes [2]
(Fig. 3.1). In particular, the implanted muon hydrogen bonds to the oxygen ion with a bonding radius of
planes [2]
(Fig. 3.1). In particular, the implanted muon hydrogen bonds to the oxygen ion with a bonding radius of
![]() Å. This single muon stopping site assignment is consistent with Fig. 5.3, which shows only one
well-resolved signal with an average frequency shift relative to the Larmor precession frequency of the positive muon in
vacuum.
Å. This single muon stopping site assignment is consistent with Fig. 5.3, which shows only one
well-resolved signal with an average frequency shift relative to the Larmor precession frequency of the positive muon in
vacuum.
Figure 5.4 shows the temperature dependence of the difference between the average local magnetic field
![]() at the muon site and the external magnetic fields
at the muon site and the external magnetic fields ![]() =
= ![]() Oe,
Oe, ![]() Oe,
Oe, ![]() Oe and
Oe and ![]() Oe. The open circles
represent measurements at
Oe. The open circles
represent measurements at ![]() =
= ![]() Oe on a second Pr
Oe on a second Pr![]() Ce
Ce![]() CuO
CuO![]() single crystal. Above
single crystal. Above ![]() ,
, ![]() -
-
![]() is a linear function of
is a linear function of ![]() (see inset of Fig. 5.4) which corresponds to a
(see inset of Fig. 5.4) which corresponds to a ![]() Knight
shift,
Knight
shift,
| (6.3) |
![\includegraphics[width=14cm]{freq-shift-temp.eps}](img238.png)
|
Figure 5.5 shows a plot of the intrinsic ![]() Knight shift
Knight shift ![]() against the measured bulk magnetic
susceptibility
against the measured bulk magnetic
susceptibility
![]() . The negative value of
. The negative value of ![]() in the normal state results from the dipolar fields of
electronic Pr magnetic moments, which are induced by the external magnetic field. Below
in the normal state results from the dipolar fields of
electronic Pr magnetic moments, which are induced by the external magnetic field. Below ![]() , the average internal magnetic
field increases such that for low
, the average internal magnetic
field increases such that for low ![]() ,
, ![]() is actually greater than the value of the applied field. This is unusual
because a fundamental property of a superconductor is it that it expels magnetic field. In contrast to the normal state,
is actually greater than the value of the applied field. This is unusual
because a fundamental property of a superconductor is it that it expels magnetic field. In contrast to the normal state,
![]() -
- ![]() is not a linear function of
is not a linear function of ![]() and is reduced with increasing
and is reduced with increasing ![]() .
.
![\includegraphics[width=16cm]{knight.eps}](img240.png)
|
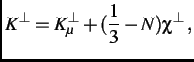
As shown in Fig. 5.6, the increase of ![]() with decreasing temperature nearly coincides with the
diamagnetic shift observed below
with decreasing temperature nearly coincides with the
diamagnetic shift observed below ![]() in bulk magnetic susceptibility measurements taken under FC conditions. Such
behaviour could be associated with the so-called paramagnetic Meissner effect (PME) [27], which is a
reported anomalous paramagnetic response in dc FC magnetization measurements. However, magnetization measurements taken
under both FC and ZFC conditions show a diamagnetic response that is inconsistent with this interpretation. A second
possible explanation is that the Pr electronic moments induce screening currents in the CuO
in bulk magnetic susceptibility measurements taken under FC conditions. Such
behaviour could be associated with the so-called paramagnetic Meissner effect (PME) [27], which is a
reported anomalous paramagnetic response in dc FC magnetization measurements. However, magnetization measurements taken
under both FC and ZFC conditions show a diamagnetic response that is inconsistent with this interpretation. A second
possible explanation is that the Pr electronic moments induce screening currents in the CuO![]() planes [28].
However, unlike the large rare-earth moments in the RBa
planes [28].
However, unlike the large rare-earth moments in the RBa![]() Cu
Cu![]() O
O![]() (R
(R ![]() Gd, Er) compound studied in
Ref. [28], the Pr moments induced at low fields are too weak to induce a significant shift of the local magnetic
field. In particular, at
Gd, Er) compound studied in
Ref. [28], the Pr moments induced at low fields are too weak to induce a significant shift of the local magnetic
field. In particular, at ![]() =
= ![]() Oe and
Oe and ![]() =
= ![]() K (see Fig. 5.4 inset),
K (see Fig. 5.4 inset), ![]() -
-
![]() G, whereas
G, whereas ![]() -
-
![]() G at
G at ![]() =
= ![]() K.
K.
![\includegraphics[width=13cm]{suscept-freq.eps}](img246.png)
|
A third possible origin of the increased internal magnetic field below ![]() is that the vortices stabilize magnetic order
of the Cu spins. This has recently been observed in a neutron scattering study of underdoped La
is that the vortices stabilize magnetic order
of the Cu spins. This has recently been observed in a neutron scattering study of underdoped La![]() Sr
Sr![]() CuO
CuO![]() (
(![]() =
= ![]() ) single crystals [29]. Although the difference between the average local magnetic field in the
superconducting state (
) single crystals [29]. Although the difference between the average local magnetic field in the
superconducting state (![]() ) and the normal state (
) and the normal state (![]() ) of Pr
) of Pr![]() Ce
Ce![]() CuO
CuO![]() decreases as
decreases as ![]() increases, it does not necessarily imply that the additional magnetism below
increases, it does not necessarily imply that the additional magnetism below ![]() weakens with increasing
weakens with increasing ![]() .
Figure 5.7 shows a plot of
.
Figure 5.7 shows a plot of ![]() -
- ![]() as a function of
as a function of ![]() at temperatures
at temperatures ![]() =
=
![]() K and
K and ![]() K. The solid curves are fits to the relation
K. The solid curves are fits to the relation
![\includegraphics[width=13cm]{add-field.eps}](img252.png)
|
Figure 5.8 shows two proposed Cu-spin structures for the parent compound Pr![]() CuO
CuO![]() [30,31]. In both structures, the Cu spins are antiferromagnetically ordered in the CuO
[30,31]. In both structures, the Cu spins are antiferromagnetically ordered in the CuO![]() planes.
However, in the collinear structure, Cu-spins in adjacent CuO
planes.
However, in the collinear structure, Cu-spins in adjacent CuO![]() planes are aligned either parallel or antiparallel to each
other, whereas in the non-collinear structure, Cu-spins in adjacent CuO
planes are aligned either parallel or antiparallel to each
other, whereas in the non-collinear structure, Cu-spins in adjacent CuO![]() planes are aligned perpendicular to one another.
Also shown in Fig. 5.8 is a plot of the calculated magnitude of the magnetic field at the muon stopping
site due to the dipolar fields of the Cu moments as a function of the canting angle
planes are aligned perpendicular to one another.
Also shown in Fig. 5.8 is a plot of the calculated magnitude of the magnetic field at the muon stopping
site due to the dipolar fields of the Cu moments as a function of the canting angle ![]() between the Cu spins and the
CuO
between the Cu spins and the
CuO![]() plane. The calculation assumes the ordered Cu moment value of 0.40
plane. The calculation assumes the ordered Cu moment value of 0.40 ![]() determined by neutron scattering in
Pr
determined by neutron scattering in
Pr![]() CuO
CuO![]() [30]. The same field-dependent neutron scattering measurements suggest that the correct Cu-spin
structure is the non-collinear one. Our calculation shows for both Cu-spin structures, the magnitude of the magnetic field
at the muon stopping site due to the Cu moments is the same. It also shows that this magnetic field is directed parallel to
the CuO
[30]. The same field-dependent neutron scattering measurements suggest that the correct Cu-spin
structure is the non-collinear one. Our calculation shows for both Cu-spin structures, the magnitude of the magnetic field
at the muon stopping site due to the Cu moments is the same. It also shows that this magnetic field is directed parallel to
the CuO![]() plane. This indicates that the onset of antiferromagnetic order is the source of the additional local magnetic
field sensed by the muons below
plane. This indicates that the onset of antiferromagnetic order is the source of the additional local magnetic
field sensed by the muons below ![]() .
.
![\includegraphics[width=12cm]{PCCOCuspin.eps}](img254.png)
|
To determine the in-plane magnetic penetration depth
![]() , the individual time histograms from the four counters
(U, D, L, R) were fit simultaneously to Eq. (2.4), assuming the spatial magnetic
field profile given by Eq. (2.8). To model the effect of the internal magnetism due to electronic and
nuclear moments on the muon-spin precession signals, several depolarization functions
, the individual time histograms from the four counters
(U, D, L, R) were fit simultaneously to Eq. (2.4), assuming the spatial magnetic
field profile given by Eq. (2.8). To model the effect of the internal magnetism due to electronic and
nuclear moments on the muon-spin precession signals, several depolarization functions ![]() were tested. For example, we
first tried
were tested. For example, we
first tried ![]() =
=
 and
and ![]() =
=
![]() which assumes these static magnetic moments are
dense and dilute respectively. In the final analysis a power exponential function,
which assumes these static magnetic moments are
dense and dilute respectively. In the final analysis a power exponential function, ![]() =
=
![]() ,
with the value of
,
with the value of ![]() fixed to
fixed to ![]() . This gave fits of similar quality over the whole temperature range below
. This gave fits of similar quality over the whole temperature range below ![]() .
Figure 5.9 shows the FFTs of the muon-spin precession signal and the two different ``best-fit'' theory
functions from the time domain at
.
Figure 5.9 shows the FFTs of the muon-spin precession signal and the two different ``best-fit'' theory
functions from the time domain at ![]() =
= ![]() K. The FFT of the fit function with
K. The FFT of the fit function with ![]() =
=
 clearly
gives a more accurate representation of the measured internal magnetic field distribution than that with
clearly
gives a more accurate representation of the measured internal magnetic field distribution than that with ![]() =
=
 .
.
![\includegraphics[width=16cm]{fft-fit.eps}](img261.png)
|
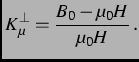
At low external magnetic field, where the density of vortices is small, few muons stop in the vicinity of the vortex cores.
Consequently, measurements at low ![]() here are not sensitive to the high-field cutoff of the measured field distribution,
which corresponds to the vortex core region. This prevents an accurate determination of
here are not sensitive to the high-field cutoff of the measured field distribution,
which corresponds to the vortex core region. This prevents an accurate determination of ![]() . Figure 5.10
shows the temperature dependence of the in-plane magnetic penetration depth determined with the value of
. Figure 5.10
shows the temperature dependence of the in-plane magnetic penetration depth determined with the value of ![]() fixed in
the fitting procedure. The plot shows results for two different values of
fixed in
the fitting procedure. The plot shows results for two different values of ![]() . The value of
. The value of
![]() at any
given temperature differs by less than 2% for the two values of
at any
given temperature differs by less than 2% for the two values of ![]() . In the end, we fixed the value of
. In the end, we fixed the value of ![]() at
at
![]() Å, which is consistent with the value of the upper critical field
Å, which is consistent with the value of the upper critical field ![]() =
=
![]() measured
in Ref. [33].
measured
in Ref. [33].
![\includegraphics[width=15cm]{lam-xi.eps}](img265.png)
|
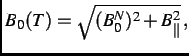
Figure 5.11 shows the temperature dependence of
![]() at
at ![]() =
= ![]() Oe. The solid curve is a
fit to the relation
Oe. The solid curve is a
fit to the relation
![\includegraphics[width=15cm]{lam-fit.eps}](img270.png)
|
Figure 5.12 shows the temperature dependence of
![]() in a second Pr
in a second Pr![]() Ce
Ce![]() CuO
CuO![]() single
crystal at
single
crystal at ![]() =
= ![]() Oe. The large error bars indicate that
Oe. The large error bars indicate that
![]() is poorly determined due to the broadening
effects with increased applied magnetic field described earlier.
is poorly determined due to the broadening
effects with increased applied magnetic field described earlier.
![\includegraphics[width=12cm]{pcco9.eps}](img271.png)
|
![\includegraphics[width=12cm]{ehlambda.eps}](img272.png)
|
Figure 5.13 shows the normalized magnetic penetration depth
![]() plotted as a function of the reduced temperature
plotted as a function of the reduced temperature ![]() at
at ![]() =
= ![]() Oe. Also shown are measurements in
La
Oe. Also shown are measurements in
La![]() Sr
Sr![]() CuO
CuO![]() at
at ![]() =
= ![]() kOe [13] and YBa
kOe [13] and YBa![]() Cu
Cu![]() O
O![]() at
at ![]() =
= ![]() kOe [34] from
earlier
kOe [34] from
earlier ![]() SR studies. The graph, which assumes a value of
SR studies. The graph, which assumes a value of
![]() =
= ![]() Å for Pr
Å for Pr![]() Ce
Ce![]() CuO
CuO![]() shows reasonable agreement with the hole-doped cuprates at temperatures down to
shows reasonable agreement with the hole-doped cuprates at temperatures down to
![]()
![]() . Unfortunately, the
cryostat used for cooling the crystals was limited to
. Unfortunately, the
cryostat used for cooling the crystals was limited to
![]() K. This prevented a precise determination of the low
temperature limiting behaviour of
K. This prevented a precise determination of the low
temperature limiting behaviour of
![]() .
.
![\includegraphics[width=8cm]{FCfield.eps}](img218.png)
![\includegraphics[width=8cm]{ZFCfield.eps}](img219.png)
![\includegraphics[width=8cm]{FCtemp.eps}](img220.png)
![\includegraphics[width=8cm]{ZFCtemp.eps}](img221.png)
 where
where  (dotted line).